


If you are majoring in biological sciences, then chances are you’ve taken an introductory statistics course at some point in your studies. While this was probably one of the most boring courses you’ve ever taken (trust me, I know!), the hours of stress and frustration at finding the right answers are designed to give you the fundamentals you need to successfully produce meaningful analyses in your work.
Back when I was studying, SPSS was the go-to statistical software that just about everyone in the industry used to determine the significance of their work. Unfortunately, this software was difficult to use and lacked the intuitiveness that is necessary to maintain interest in the statistical field.
This leads us to our first software spotlight. I recently gave a lecture and briefly mentioned the usefulness of RStudio for performing many biological analyses. After the class, a student approached me to ask more about this software, as he hadn’t heard of it before. This was perplexing, as RStudio is immensely popular amongst my peers. However, like with all well-used software packages, finding the general information that can convince you that you need it can be hard.
Here, we give you a rundown of RStudio, including the benefits and utility in many biological aspects.
What is R?
R is a statistical computing environment that allows for comprehensive analysis of biological data. R is an Open Source environment, which means that anyone can design and implement custom packages and modules that can be used within the R framework. Because of this, there is a wealth of resources online that cater to any analysis scenario, in addition to the base statistical functions that allow for routine analyses involving linear and non-linear modelling, classification and clustering, survival analyses and much more. However, the beauty of R is the fact that it can produce publication-ready plots and visualisations.
R is used through a command-line interface, but this can be cumbersome for users without experience in this type of usage. RStudio bridges this gap by providing a graphical user interface that allows easier use of the environment as well as accessibility to packages, functions and plot display.
RStudio
You might be wondering why you would want to use RStudio when R itself contains the guts of the software. Simply put, RStudio brings all of the most useful parts of R together in one window. Acting as a wrapper for the R environment, you can easily edit and format your code, visualise results and assess your environment all in one place. Here, we take you through the ins and outs of the RStudio interface.
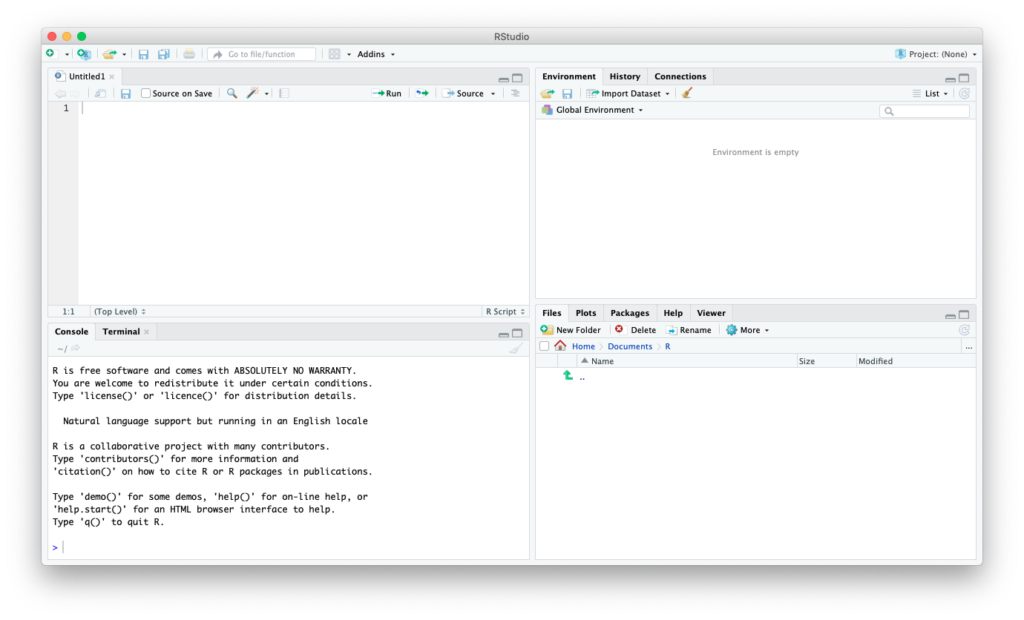
If you look closely, you will see that the Console panel in the bottom left is simply what you would see when you load up R on the command line. Here, you can enter and execute your code in the same way you would do when using R just by itself. The Terminal pane beside it will give you instant access to your terminal so that you don’t have to switch back and forth. However, the benefit of RStudio lies in the surrounding panels.
The Source panel, located in the top left, allows you to seamlessly edit your code in a way that is retainable after execution. This pane features syntax highlighting which makes for easy comprehension, and allows you to run your code via the button in the toolbar.
The top right pane features the Environment, History and Connection panels. In the Environment panel, you will see all variables and objects that you have created throughout your session, giving you the ability to perform robust integrity checks when things aren’t running as they should. The History panel saves all commands that you have run and can prove to be a very resourceful place that can keep you up to speed on what you have previously executed. The Connection panel allows you to connect to external data sources for your work.
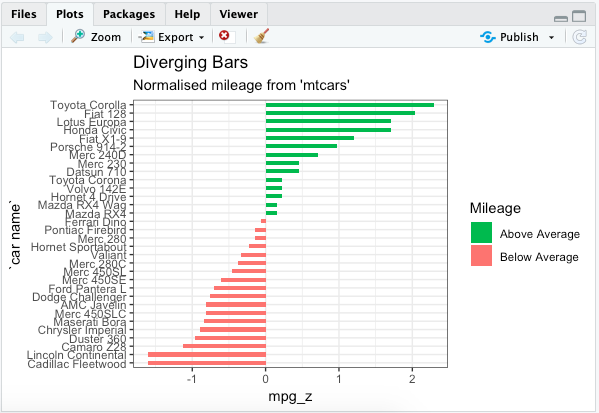
Example plot taken from The Top 50 ggplot2 Visualizations (http://r-statistics.co/Top50-Ggplot2-Visualizations-MasterList-R-Code.html) shown in the Plots pane
At the bottom left you will find a number of other panels. The Plots panel allows you to visualise your results without having to open the file directly, and can allow you to effortlessly scroll through the plots you have generated in your session. The File Manager panel gives you the directory listing of your current working directory, and the Packages pane gives you access to all installed packages and allows you to see which are loaded at any given time.
Extendability of R
While the base R software is robust for statistical programming, the utility can be extended through the sheer number of packages that have been developed over time. There are many package repositories for R, but for budding biological scientists, one of the best free resources available is Bioconductor. Here, you will find thousands of prewritten packages that allow for robust analyses of just about any kind of data and even complete workflows that can take you through your analysis from start to finish.
Conclusion
If you are creating robust R scripts, then using RStudio will save you time given the ease of debugging lengthy code. The ability to combine a script editor, console and package manager allows for refined and efficient use of the software, and will allow for higher levels of customisation to produce publication-ready images.


